Configuration
|
|
You can choose to display a Pivot Table, Pivot Chart or both a chart and table. | ||||||||||||||||||||
 |
You base the PivotPoint web part on any view from the current site by selecting it in the dropdown. You can optionally filter by any public view. If you don't choose a view then all records in the list will be used. Using views gives you great flexibility to filter the data you want to include in the PivotPoint web part - for example you may want to list the total of unpaid invoices per client. This page may help if you are unfamiliar with SharePoint views. |
||||||||||||||||||||
 |
Normally PivotPoint only allows you to use SharePoint built in field types. If you want to use custom field types inside PivotPoint you can select this checkbox. Please Note - Depending upon their design, custom field types may not work correctly with PivotPoint and we are unable to provide technical support for problems due to using 3rd party custom field types. |
||||||||||||||||||||
 |
You can select which field to use for the Column and/or Row values. You can choose to sort these values in Ascending or Descending order and by either the Title or the Total columns.
Note - this feature is new in PivotPoint v2.2.3, see also the Show Top N option You can also choose to display Totals for the Rows/Columns Additionally if a column type supports it you can enable the user to click on a column and "Drill Down" to see the record details. |
||||||||||||||||||||
 |
If the Column or Row is a Date field then you are given additional options on how to group different dates together.  |
||||||||||||||||||||
 |
You can choose which field to use for the Cells value and the calculation that should be applied. Depending on the data type of the field not all options will be available.
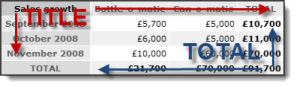
If both the Row and Column fields support drill-downs you can enable a drill-down on the cell values - for example with the Pivot Table example shown above you could see the September sales of Bottle-o-matic by clicking on the £5,700 cell. |
||||||||||||||||||||
See the Drilldown page for more information |