Workload Monitoring
|
Keeping close tabs on your team’s workload is a key task for any manager. As a manager you need to by constantly aware of:
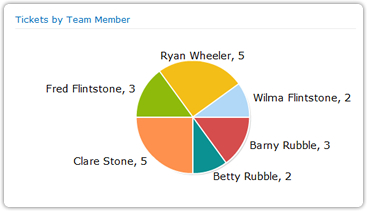
In this example we are going to use PivotPoint with a SharePoint “Issues” list, to monitor the activity of a Help desk or customer service team and address these issues. The dashboard on the right shows you how, using 2 PivotPoint web parts, you can monitor activity in your issues list to keep on top of staff workloads and KPI’s. In this example, you can see that although workload should be spread equally between all team members, Clare has far more on her plate that the others, with 40% of the open tickets. You can also see that although the team is targeted to resolve all issues within 3 working days, you still have 5 tickets open which are approaching that deadline, 3 of them “High” Priority. So we need to take some action to sort this situation out. |
 |
|
From the dashboard you can click on any segment of your data to “drill down” to the individual tickets. Clicking on Clare’s tickets in the pie chart shows us this:  We can see that Clare has a lot of old tickets hanging around, she’s not getting things cleared up quickly enough, and 2 of the High Priority Tickets that are nearly overdue are sat in her box. So, let’s reassign some of these tickets, including the 2 High Priority ones, to team members with less on their plates, Betty, Barny and Wilma look like they might have time for a little extra work.
Going back to the dashboard we can see that thing’s now look a lot more under control. |
|
 |
|
Thanks for registering We need to confirm your email address so we have just sent you an email. To complete the registration process please click the link in the email and you will have immediate access to the download |


