
Sales Pipeline Dashboard
 |
||
|
|
||
In this example we have used PivotPoint to create a Sales Pipeline Dashboard.
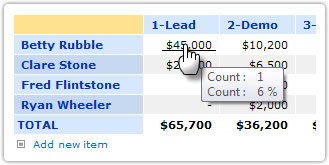
The Dashboard shows a visualization of the pipeline as a funnel chart, showing the value of potential sales at each stage of the pipeline. Along with this, a Pivot Chart, shows sales at each stage of the pipeline for each member of the sales team, with values shown on the chart, and number of deals shown in the tooltip. As with all Pivot Point Dashboards we can click on any area of the chart or table to drill down to the list items which make it up, so we could click here to go straight to Fred's deals that are at the "Trial" stage and take a closer look and as list items are added or updated we can see the dashboard updating dynamically to reflect those changes. The Dashboard is created by applying one PivotPoint web part to a "Sales Prospects" list. The key to setting up the dashboard is the structure of your list. You might find that an issues list is the best list type for keeping track of pipeline prospects, as it allows you record your comments and actions at each stage of the process, and attach documents such as proposals or quotations as needed. |
||
|
Whatever list type you choose you will need a number of fields in place to generate useful Dashboard information. |
||
|
Sales person - in an issues list you will be able to use the "Assigned To" field for this, if you are using another type of list you may need to add a person or group field. |
||
|
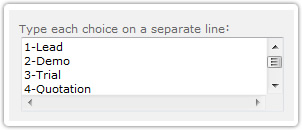
Stage. To create a meaningful pipeline visualization in a funnel chart you need to know which stage of your sales process each potential deal is at. In the example we have 5 stages from "Lead" through to "Sale". You will notice that we have numbered the stages 1 to 5.This is essential as, for a funnel you need to sort your stages in ascending order. PivotPoint can sort alphabetically or numerically, but since it's unlikely that your stages are going have names that sort in a sensible alphabetical order it is best to number them as well. |
 |
|
|
Pipeline Value. To create a sales pipeline you need to know not only the potential value of the deal, but also the % likelihood to its completion. You may choose to allow your sales team to estimate (guestimate?) the probability of a deal being completed, or you may prefer to assign a probability based on a deal's stage in the pipeline. Either way, your list will need a calculated column for "Pipeline Value" which will be the estimated deal value, multiplied by the % probability: =Value*Probability. |
 |
|
|
Though you might choose to add additional fields to your list to provide more pipeline information a list with the simple set up described above will allow you to create this dashboard with PivotPoint. |
||
 |
|
Thanks for registering We need to confirm your email address so we have just sent you an email. To complete the registration process please click the link in the email and you will have immediate access to the download |
