
Pivot Charts and Pivot Tables Together
 Pivot Charts are great for giving an at a glance visual representation of your data.
And Pivot Tables are what you need if you want to see your data in detail.
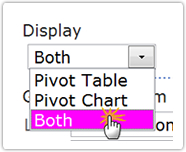
With PivotPoint you don’t need to make a choice between the two. If you want you can display your data as a Pivot Chart and a Pivot Table on the same SharePoint page.
So you have both the overview and the detail at our fingertips.

 |
|
Thanks for registering We need to confirm your email address so we have just sent you an email. To complete the registration process please click the link in the email and you will have immediate access to the download |
